EONET UI
The EONET (Earth Observing Natural Event Tracker) UI is a web application designed to provide real-time tracking and visualization of natural events across the globe. Utilizing the powerful combination of the NASA EONET API, Google Maps API, React, and Bootstrap, the application plots recent occurrences of wildfires, volcanoes, severe storms, and icebergs on a global map. The intuitive interface allows users to interact with the map and obtain detailed information about each natural event.

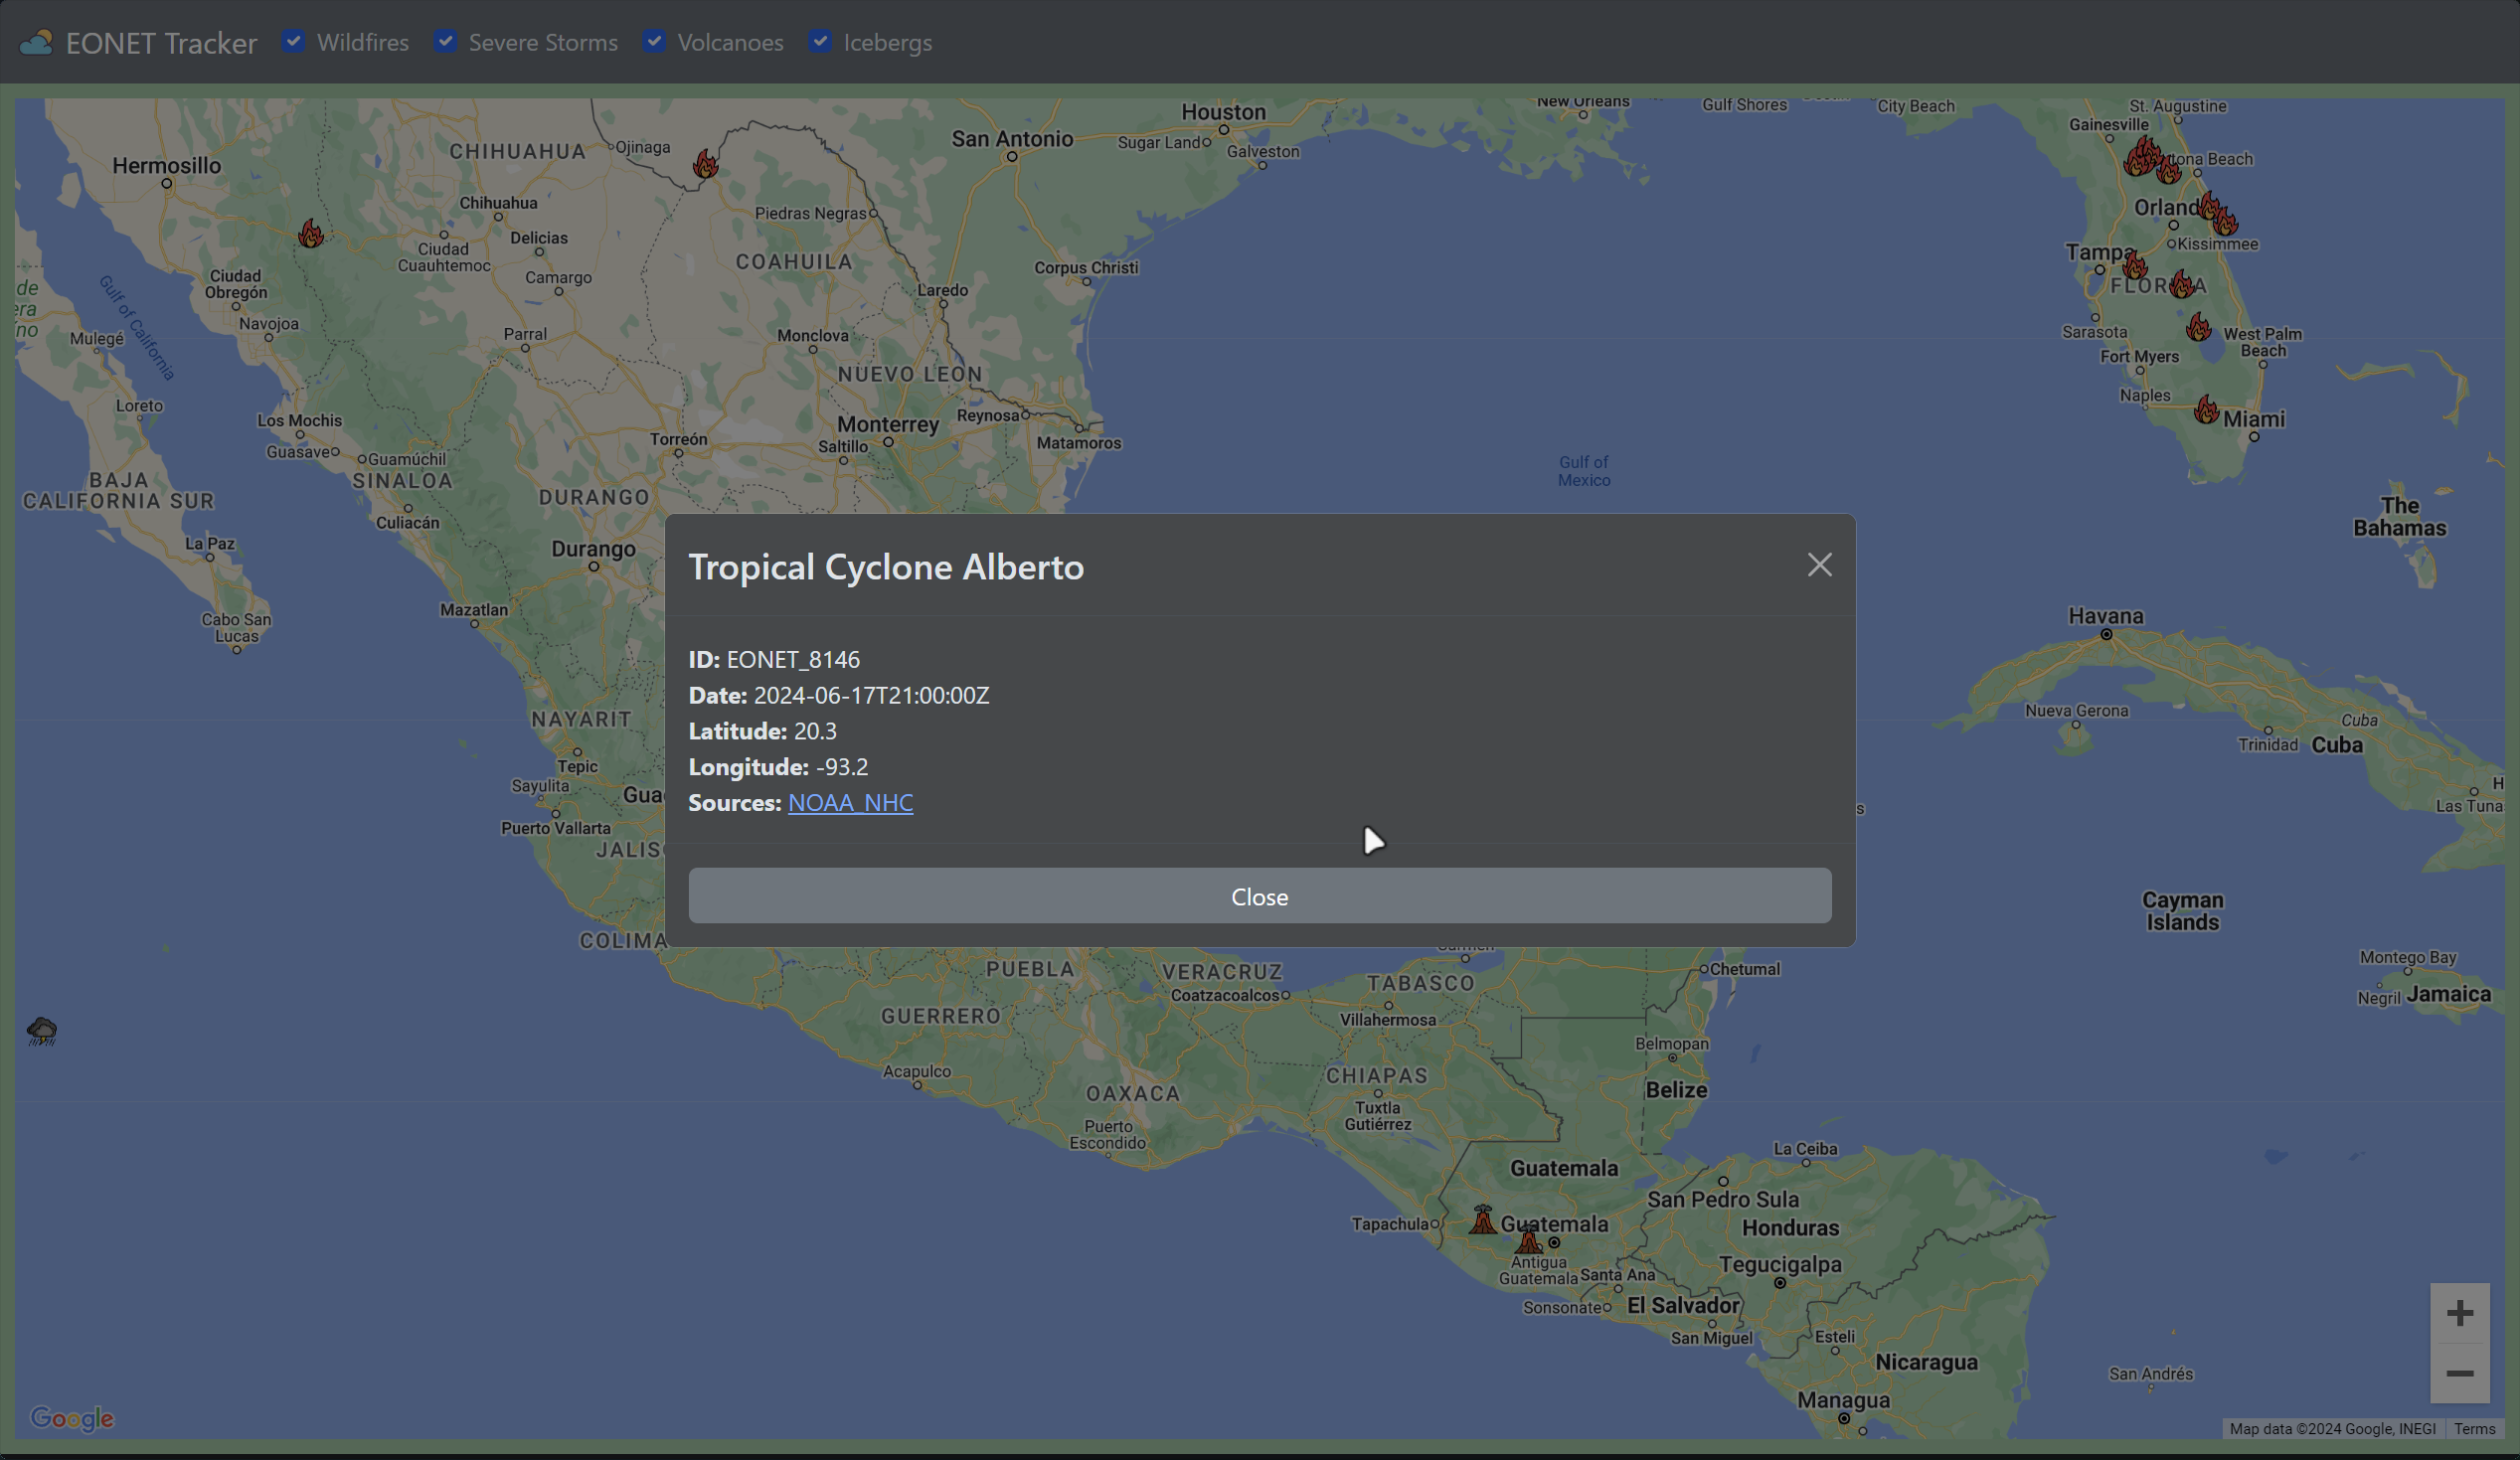
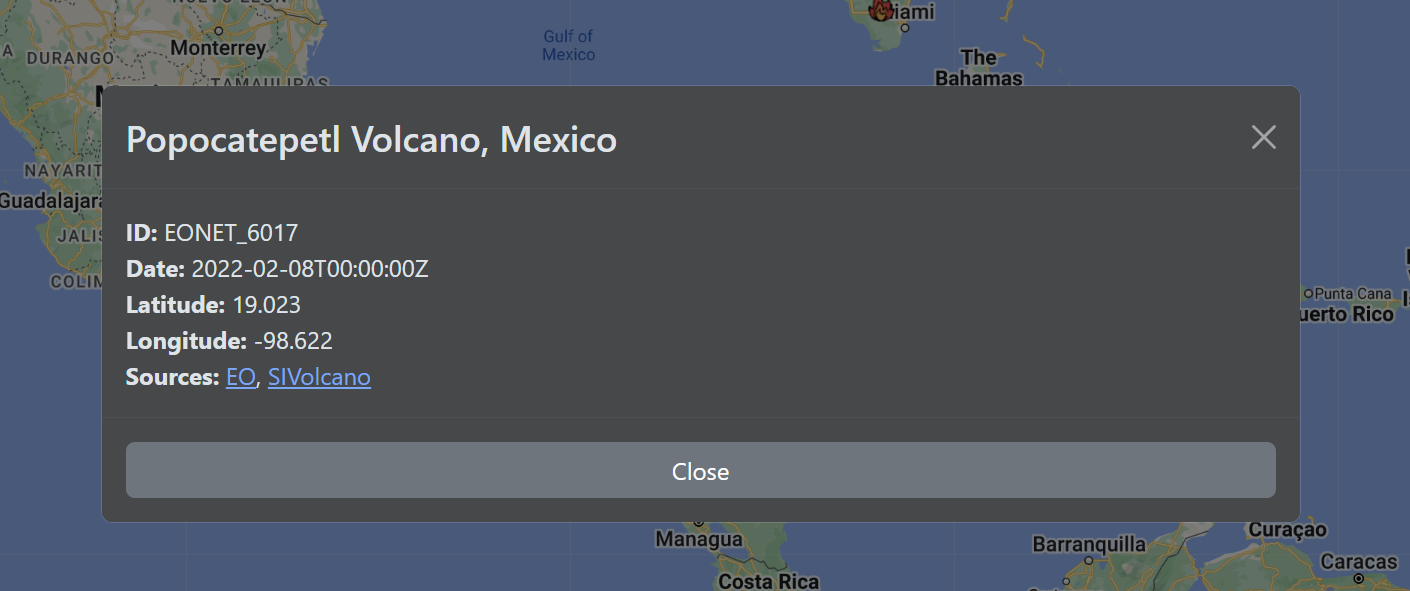
You can pan throughout the map to view the natural events that have occurred in various regions of the globe. I am currently tracking wildfires, volcanoes, severe storms, and icebergs. Each event is represented by an interactive icon that, when clicked, displays additional information about the event, such as its title, ID, the date at which it was last recorded, its precise coordinates, a brief description (for some events only), and links to sources.
Features
View information on a severe storm:

Click on a volcano icon to view its details:

There is also a filtering feature, which allows you to toggle the visibility of each event type on the map for a more focused view:

The application is fully responsive for mobile devices, making it easy to track natural events and view the UI on the go.
Implementation
- React
- Used for the frontend. Integrated global states to keep track of the map, events, and filters across various components.
- Utilized hooks to manage state and side effects.
- Google Maps API
- Integrated the Google Maps JavaScript API to display the map and plot event markers.
- Implemented event listeners to handle user interactions with the map and markers.
- EONET API
- Used to obtain real-time event data and display it on the map.
- Bootstrap